




IPISEnterprise performance and management follow-through
Integrated Performance Improvement System
See how the company is performing, and follow each action to its owner and result.
The question it answersWhen is this job really complete?


A weekly management meeting discusses why dispatch slipped and who owns the fix.
A weekly management meeting in the glazed room on the mezzanine: a manager points at the dispatch dock beyond the glass. At the dock a forklift takes a pallet into the docked trailer; the weekly on-time delivery indicator is fed from here. Back in the meeting: in the example 34 of this week's 40 orders left on time; the instruction is tied to an owner and a deadline, and its result is followed in IPIS. The KPI card and the Action Log row are in the example below.
From deviation to result: the action log
On-time delivery has fallen below target. Who owns the deviation, and how is the result followed?
Example · weekly management meeting · illustrative data
Week 46: 34 of 40 orders due for shipment left on time, a rate of 85%. Minimum 90%, target 95%: the indicator is “Below target”.
Of the 6 late orders, 4 waited for semi-finished housings below critical stock and 2 for a vehicle (4 + 2 = 6; 34 + 6 = 40).
The instruction goes into the Action Log. Owner: the planning manager; deadline: Friday 17:00 (3 working days). A reminder is sent before the deadline; status “Open”.
The task closed before the deadline. Week 47: 38 of 40 orders on time, 95%: “On target”.
On-time delivery completion rate (%) · Weekly
Week 46 · how the 40 orders went
- On time34
- Waited for semi-finished housings (critical stock)4
- Waited for a vehicle2
4 + 2 = 6 late · 34 + 6 = 40
Cause not examined yet
Action Log · sample row
Explanatory drawing; not the Action Log screen
Instruction“Review the safety-stock level for semi-finished housings; confirm a new shipping date for the 4 waiting orders.”
- Responsible (R)
- Planning manager
- Accountable (A)
- Operations director
- Consulted (C)
- Purchasing
- Informed (I)
- Sales
- Deadline
- Friday 17:00 (3 working days)
- Reminder
- Thursday (before the deadline)
- Status
- Not recorded yet Open Closed Thursday · before the deadline
IPIS shows the task’s closure and the indicator’s next period together; why the rate improved is management’s judgement.
See the example data as a table
| Week | Due for shipment | On time | Rate | Status |
|---|---|---|---|---|
| Week 46 | 40 | 34 | 85% | Below target |
| Week 47 | 40 | 38 | 95% | On target |
| Field | Example value |
|---|---|
| Week 46 · how the 40 orders went | On time: 34 · Waited for semi-finished housings (critical stock): 4 · Waited for a vehicle: 2 |
| Instruction | Review the safety-stock level for semi-finished housings; confirm a new shipping date for the 4 waiting orders. |
| Responsible (R) | Planning manager |
| Accountable (A) | Operations director |
| Consulted (C) | Purchasing |
| Informed (I) | Sales |
| Deadline | Friday 17:00 (3 working days) |
| Reminder | Thursday (before the deadline) |
| Status | Open → Closed Thursday · before the deadline |
Example context: who, where, with which data
- Who
- Managing director, operations director, planning and finance managers · weekly management meeting
- Where
- Management office on the mezzanine · the production hall and dispatch dock beyond the glass
- Input
- Example · Week 46: 34 of 40 orders due for shipment left on time (85%); target 95%, minimum 90%
- What changes
- The KPI card, the breakdown of late orders, the Action Log row and the next week’s rate appear in turn; the same values hold at every step.
The product’s own screen
Product screen · name edited

Product screen · sample data
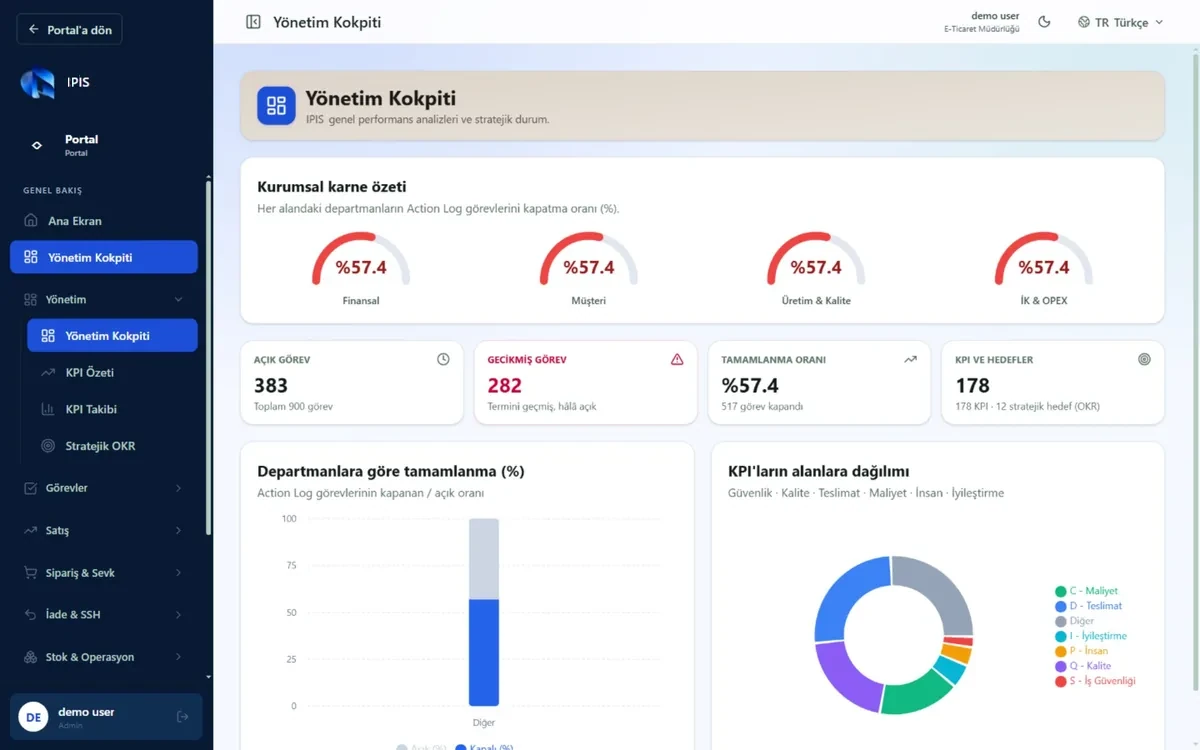
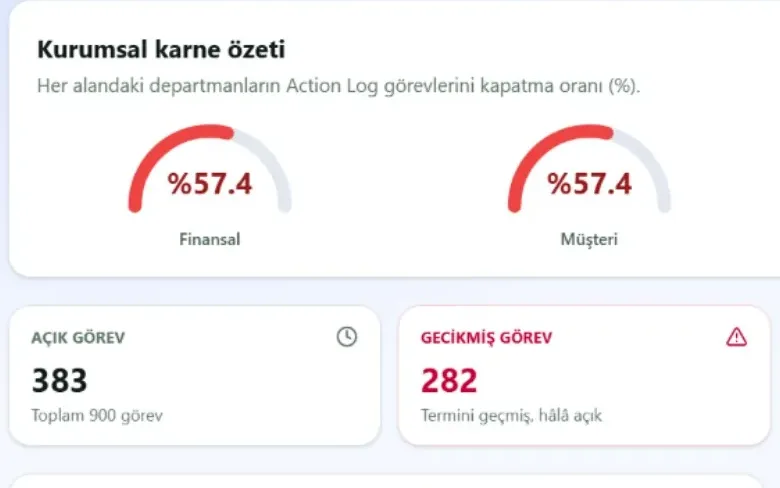
The "Kurumsal karne özeti" (corporate scorecard) shows the Action Log task closure rate per area ("Finansal" and "Müşteri" at %57.4); directly below, "AÇIK GÖREV" (open tasks) 383 of "Toplam 900 görev" and "GECİKMİŞ GÖREV" (overdue tasks) 282, "Termini geçmiş, hâlâ açık" (past due, still open), sit on the same screen. (demo environment, sample data)
Product screen · name edited

Product screen · sample data
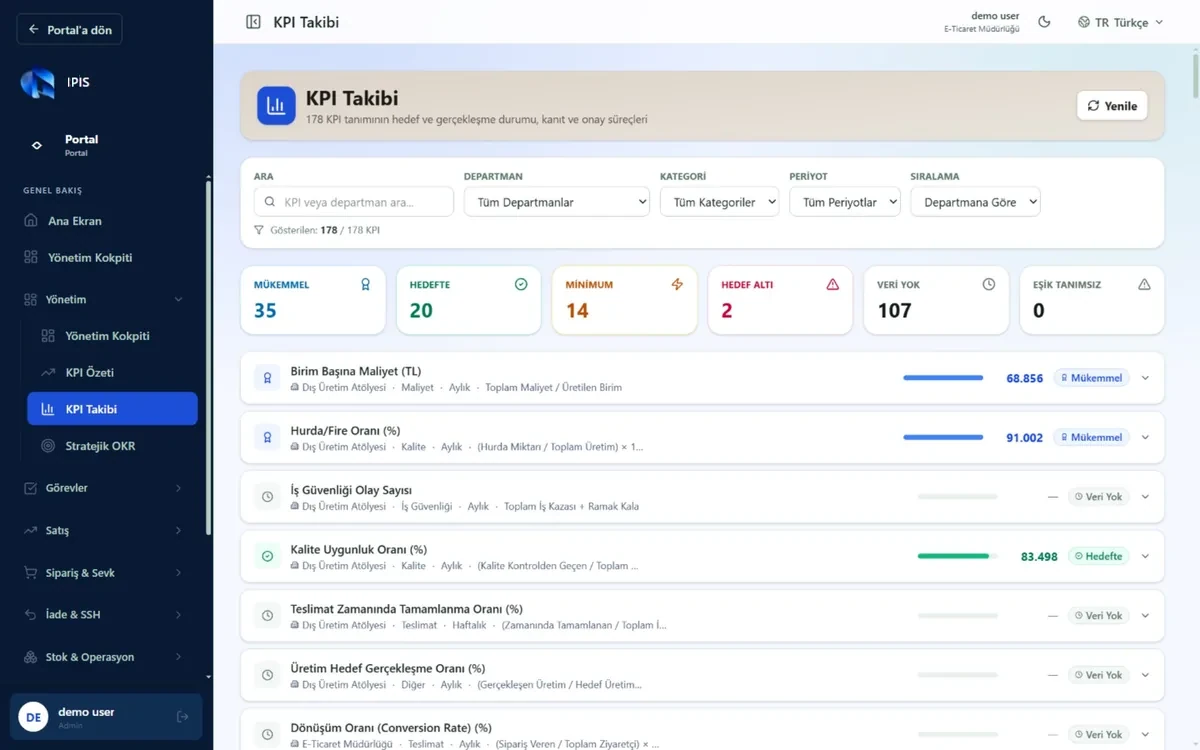
KPI tracking: status counters “Mükemmel”, “Hedefte”, “Minimum”, “Hedef Altı”, “Veri Yok” and “Eşik Tanımsız” (excellent, on target, minimum, below target, no data, no threshold); the list includes the weekly “Teslimat Zamanında Tamamlanma Oranı (%)” (on-time delivery completion rate).
IPIS — Screens
The data on screen is sample data.
Try it on an example The interactive example on this page
What IPIS does
Who it is for, and why
IPIS brings company performance into one management cockpit, from KPIs and OKRs to sales, stock, procurement and finance. Executives and department managers can tie a deviation to the person responsible and follow each instruction through its deadline to its result.
- Outcome
- The deviation is visible, the owner is clear and the result is followed.
- For
- Executives and department managers; sales, finance, procurement and operations teams
- The problem
- Performance, sales, stock, procurement and finance information sits in separate spreadsheets and ERP reports; who received a management instruction and when it was closed is not recorded.
- Why it matters
- By the time a deviation shows in a report, the window to act has often closed, and the result of a decision goes unfollowed.
- What you gain
- Leadership ties a performance deviation to the person responsible and follows the instruction through its deadline to its result from one management view.
How it works · in text5
- Connect your sources: sales, shipping, stock, procurement and finance records are read from your ERP and other systems through data adapters.
- Set the targets: KPI targets and thresholds, OKRs and RACI roles are defined in IPIS.
- See the deviation: the management cockpit and KPI tracking highlight any indicator below target with a status colour.
- Record the instruction: an instruction given in the meeting goes into the Action Log with its owner and deadline; a reminder is sent before the deadline and a notice if it is late.
- Follow the result: the task's closure and the indicator's next period appear in the same management view.
Example: at the weekly meeting on-time delivery is 85 % (34 of 40 orders), below target. Of 6 late orders, 4 waited for semi-finished stock and 2 for a vehicle. An instruction to the planning manager, due Friday 17:00, goes into the Action Log; it closes on Thursday and the next week shows 95 % (38 of 40).
Management and performance4
- Management cockpit and periodic PDF report
- KPI tracking and summary: status by target, actual and threshold
- Strategic OKRs
- RACI matrix: responsibility and approval roles by process
Tasks and actions4
- Action Log: instruction, owner, deadline, recurrence and feedback
- My tasks and reminders
- Action Log performance: completion and delay by person and department
- Automatic notifications: pre-deadline reminders, delay and event e-mails
Sales, orders and shipping7
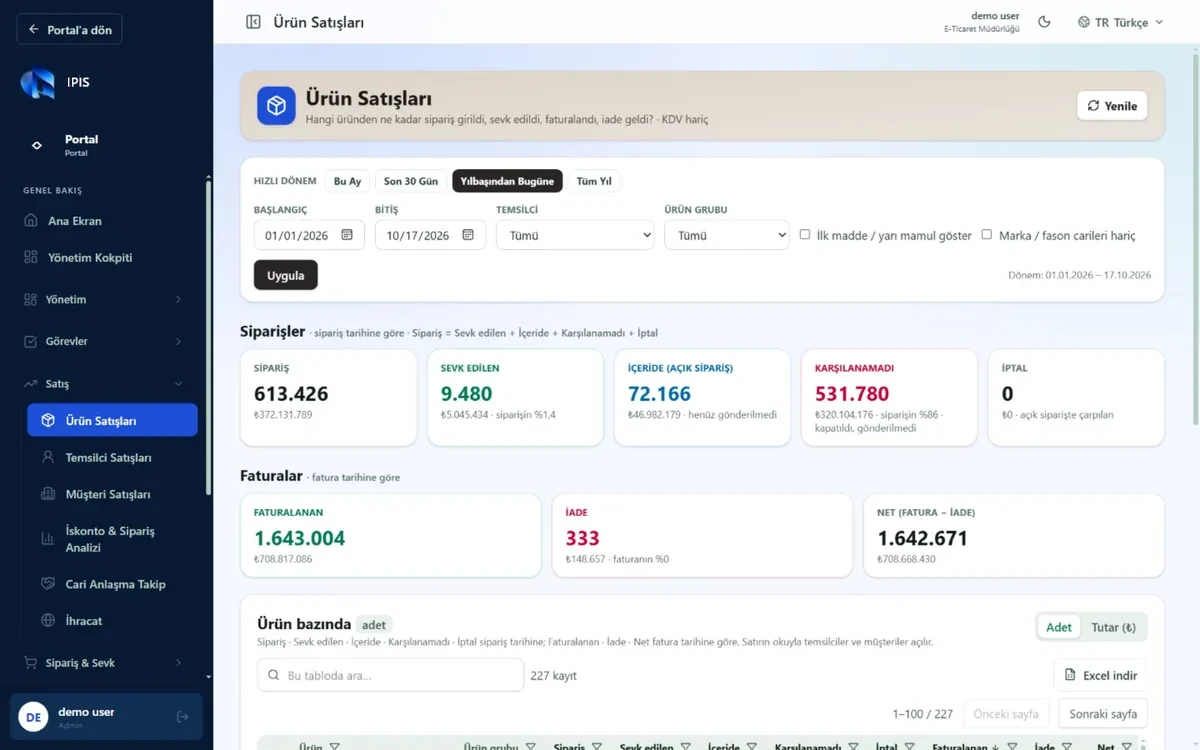
- Sales by product, representative and customer: orders, shipments, invoices and returns
- Discount and order analysis
- Ready-to-ship orders and daily flow
- Shipping times and order-to-invoice checks
- Freight payments and parcel cost
- Returns and after-sales service
- Product card, representative scorecard, customer agreements and exports
Stock and operations5
- Product-group and semi-finished stock: days of cover and critical-stock alerts
- Aged stock sales tracking
- Safety stock tracking with alerts by owner
- Maintenance management
- Vehicle tracking
Supply chain and imports7
- Requests and catalogue management
- Quotation collection (RFQ) and price comparison
- Pro forma approval flow
- Supplier production, loading and in-transit tracking
- Import pre-costing
- Supplier performance
- Requests compared with ERP purchasing records
Finance and collections7
- Budget and forecast
- Revenue and break-even analysis
- Expense anomaly detection
- Collection performance and ageing
- Commission calculation
- Customer account and cheque risk
- Credit card collections
Finance and collections · example
Sample order · day = days from shipment
Yes, day 0: the shipping record shows it. Operationally the job is done; financially nothing has happened yet.
Yes, day 1: the invoice record shows it. An invoice creates a receivable, not a payment.
Day 60: the term has run out and the receivable is still open. The due date on the invoice shows this; it says nothing about payment.
Day 75: when the collection record arrives, the job is financially complete. 75 days from shipment, 15 days after the due date.
The record that establishes it
Shipping record (delivery note)
Shipped · 24 units · day 0
Invoice record (accounting / ERP)
Invoiced · day 1
Due date on the invoice (payment term)
Due date · day 60
Collection record (bank / account entry)
Collected · day 75
Operational completionday 0Shipping record (delivery note)
Financial realizationday 75Collection record (bank / account entry)
See the example data as a table
| Event | Day | Timeline | Record |
|---|---|---|---|
| Production slip closed · 24 units | 0 | Operational completion | OPAS production slip |
| Shipped · 24 units | 0 | Operational completion | Shipping record (delivery note) |
| Invoiced | 1 | Financial realization | Invoice record (accounting / ERP) |
| Due date | 60 | Financial realization | Due date on the invoice (payment term) |
| Collected | 75 | Financial realization | Collection record (bank / account entry) |
Integration and deployment
Sales, stock, procurement and finance screens draw their data from your ERP and other connected sources; a screen whose source is not connected stays empty. IPIS does not change existing records in the source systems. KPI definitions, OKRs, RACI roles and Action Log entries are kept in IPIS. Which modules are switched on depends on the sources connected and the pilot scope.
Data, access and who decides5
| Data it uses | Sales, shipping, stock, procurement and finance data, read from the ERP and other source systems through adapters. |
|---|---|
| Data access | Through the platform’s single sign-on; each user sees only the modules they are authorised for. |
| Analysis | KPI and OKR status, budget and forecast, expense anomalies, collection performance and customer risk. |
| Who sees the result | Senior management and department managers; tasks are assigned to the people responsible through the Action Log. |
| Who decides | Managers decide; the RACI matrix and Action Log make responsibility and follow-up visible. |
Which modules are switched on depends on the data sources connected during installation and on the pilot scope.



Discuss this application with your own data
In a first conversation we discuss your business priorities, your data sources and a suitable unit for a pilot.